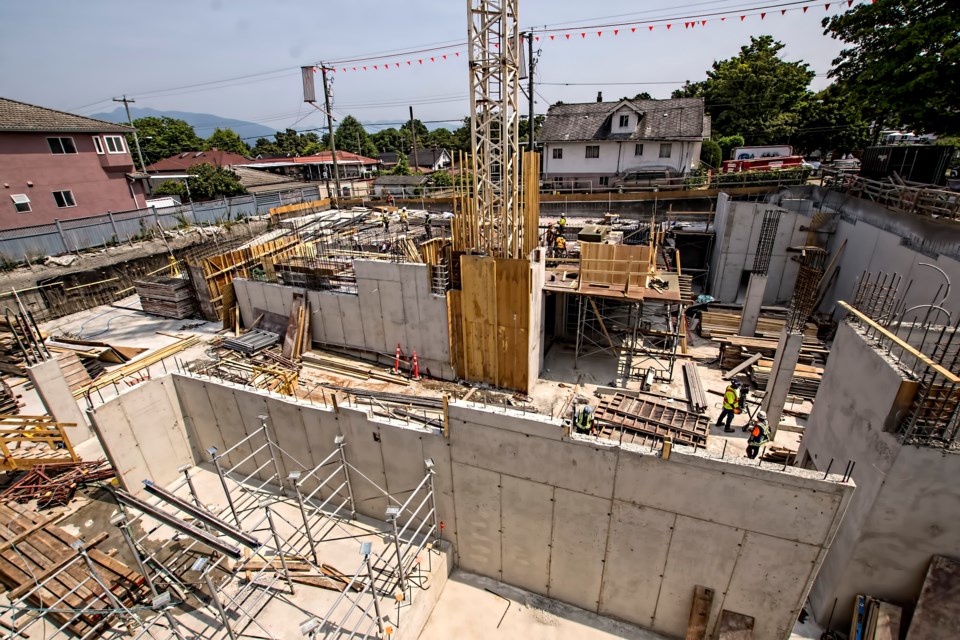
Increased land-use regulations are being linked to increased unaffordability in Canadian cities in a new survey from the sa���ʴ�ý Mortgage and Housing Corp. (CMHC) and Statistics sa���ʴ�ý.
Metro Vancouver and the Greater Toronto Area earned the survey’s highest residential land-use regulation scores at 98 and 100, respectively.
Toronto’s score is meant to serve as a yardstick whereby scores below 100 indicate less regulation than the Toronto area and scores above that figure indicate more regulation relative to the area.
The rest of sa���ʴ�ý received a score of 79, while Saskatchewan had the lowest score at 66.
“Because housing supply is so important, we want to look into the different things that might be holding supply back. This is one of those things … that we can look at in order to find ways to make the responsive supply more efficient so we can improve housing affordability,” CMHC chief economist Bob Dugan said in an interview.
The 2022 Municipal Land Use and Regulation Survey fills in gaps from a previous CMHC report released in 2018. The earlier report expressed concerns about the connection between land-use regulation and increasing prices in large metropolitan areas. Dugan said the most recent survey validated those concerns.
“It confirmed what we found back in 2018, that higher levels of regulation tend to be associated with lower levels of affordability, probably because it has an impact on how quickly housing supply can respond to increasing demand conditions,” said Dugan.
Metro Vancouver also ranked first for housing approval delays.
Both the Vancouver and Toronto areas have approval times that are almost four times as long as regions with more affordable housing, according to the survey.
Dugan said that one of the biggest predictors of unaffordability is the delay in housing approvals.
“Longer approval times seem to be the most highly correlated with affordability challenges,” he said. “In an environment of high interest rates, if a developer is holding onto a property and financing the cost of that property at higher rates for longer, that can add to costs and ultimately gets reflected in the price,” he said.
Vancouver is ranked as the most unaffordable area in sa���ʴ�ý based on having the highest house-price-to-income ratio, according to the July 13 report.
The Vancouver census metropolitan area (CMA) received a housing-price-to-income ratio of 14.18, while the Victoria CMA received a 10.04. These are the only two CMAs in sa���ʴ�ý with a ratio above 10.
The region received a housing-price-to-income ratio of 14.19, while the Victoria census metropolitan area received a 10.04. These are the only two areas in sa���ʴ�ý with a ratio above 10. The rest of sa���ʴ�ý scored a 7.45.
The hope is that this data can inform municipalities and urban centres on the biggest barriers they face to adding more housing supply and improving affordability.
Dugan said results of the survey “feed nicely” into the Housing Accelerator Fund, which provides incentive funding to local governments who create initiatives to increase supply.
“Maybe this helps them identify where the low-hanging fruit is or the biggest impediments to supply so that they can successfully participate in the program and get access to funding that will help improve the supply of housing in their municipality,” he said.
Dugan said the CMHC hopes to do more research in this area but wanted to publish data as fast as possible to inform municipalities and give researchers access to survey results.


